
|
Strategy Share: Visualizing it!
One of the things that people mentioned to me when I told them that I was going to Iceland was that it is a great place to see the Northern Lights. While that is true, the ability to see the Northern Lights is very much dependent upon the seasons. Being located along the Arctic Circle comes with its own set of challenges, one of which being that in the summer they have nearly round the clock sunlight. One of the ways that I use to help share this concept with students is through the making of animated GIFs. Formulab has a great tool that allows you to see different parts of the earth at different times to see the relative light coverage. Students can lace together saved images to create GIFs like the one above. The GIF displayed is centered on Reykjavik on July 12th, 2016 (The beginning day of our voyage). As can fairly easily be seen, darkness never really covers the island, instead just barely skims the southern edge, meaning that it'll get dark, but not be completely night. Instructions on how to make a similar GIF can be found through the UNO Cartography Lab.
1 Comment
Strategy Share: Putting it on a map!
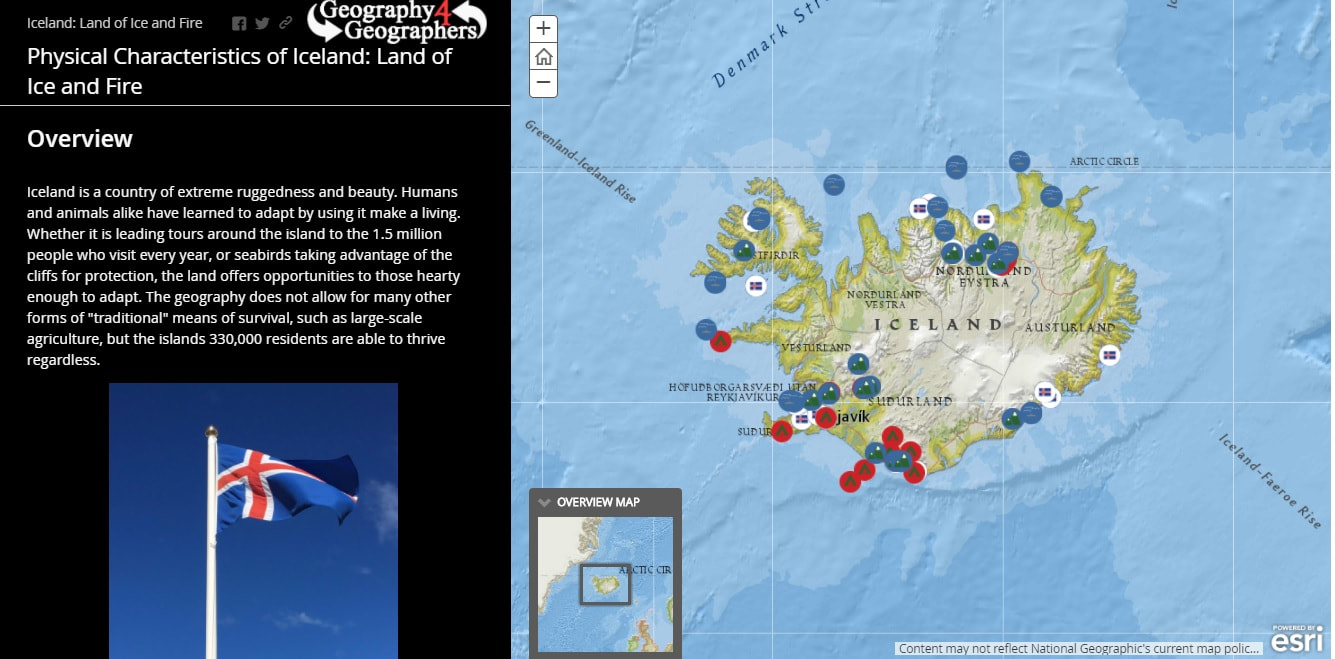
Shortly after getting back from the expedition, one of my biggest challenges was simply processing the amount of information I had received, and filtering through the thousands of photos I had taken. From the very start one of the things that I knew that I wanted to do was trying to figure out an easy way to be able to share with members of my professional organizations and my students about all of the things I was able to observe during my two weeks in Iceland with National Geographic and Lindblad Expeditions aboard the National Geographic Explorer. The first thing that naturally popped into my head was a story map. I have done a lot of work with ArcGIS and wanted to create a series of maps that not only highlighted the places that we went, but also was able to display the types of things that we had seen. The story map I came up with (previewed below or seen better by visiting HERE) was created using ArcGIS using a free organizational account (available free to educators for use in their classrooms through Esri ConnectED). Using what I had seen and learned I put together a series of information maps detailing the processes of geological geomorphology we observed, the adaptations of the island's flora and fauna, the adaptations of the Icelandic people, and just generally scenic places to see around the island. Each post was positioned on the maps as a "map note" with a picture (with links to a larger view of the picture) and informative text. The side bars highlight the theme of each section, using information learned from the naturalists and speakers aboard the ship. As a means of sharing information the map has been useful with my students and professional groups alike. I have shared the map with fellow teachers as an example of using travel experiences that they can then share with their own students. With my students I have used it as a means to share my experience in an interactive format . |
Kyle Tredinnick2017 - Grosvenor Teacher Fellow (Iceland Expedition) ArchivesCategories |
 RSS Feed

Sites published and maintained by Kyle Tredinnick | 2016-2021