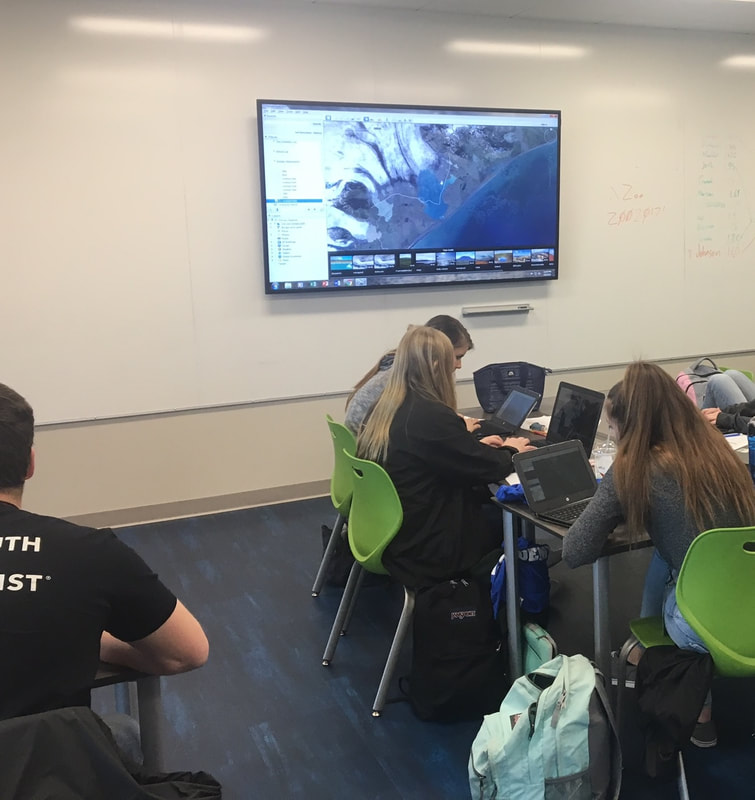
Using the Timelapse program that was developed using the Google Earth Engine it is also possible to watch the changing of the glaciers since 1984. To display this better to my students I put together a gallery of glaciers changing using the Time Machine Program, which does a great job of showing how to put together your own gallery in the available tutorial. The program I put together highlighting different glaciers can be accessed HERE. In the program you can scroll to just about any glacier or ice cap in the Northern Hemisphere you will notice a pretty significant decline. The Columbia Glacier in southern Alaska, or the Helheim Glacier in eastern Greenland also offer some interesting views of the changes glaciers are undergoing. While viewing the Vatnajokull glacier with this platform it is visible to see the glacier shrinking on all sides, and significant receding rapidly near the Breiðamerkurjökull arm. A different trend can be observed in Antarctica with the Timelapse program, where some glaciers are even growing. This article by Inside Climate News explains why the Antarctic is not impacted as much by global warming. The imagery offers a great way to show the students a broad overview, and then in the next part of the activity they can then examine a glacier more closely to find data on just how much the glaciers are retreating. One of the tools we worked with in D.C. was the historical imagery offered on Google Earth Pro. It offered an interactive way of being able to see change over time, and I thought it was a perfect way to show the real effect that climate change is having on the glaciers of Iceland. The activity I decided to put together on the topic looks specifically at imagery of the Breiðamerkurjökull glacier, which is part of the Vatnajökull Ice Cap in southeast Iceland. To have students investigate just how much glaciers are receding I have them examine Breiðamerkurjökull glacier by viewing the earth imagery from 1984 and marking the face of the glacier by drawing a path along the face of the glacier. They then examine the glacier's most recent position, which is from 2016, again marking the face using the path tool. Using the measure tool of Google Earth they then calculate the mean distance of retreat using 10 different measurements between the 2016 line and the 1984 line. More detailed descriptions of the activity are in the lesson plan and assignment handout located below.
2 Comments
|
Kyle Tredinnick2017 - Grosvenor Teacher Fellow (Iceland Expedition) ArchivesCategories |
||||||||||||||||||


 RSS Feed
