Geography for Geographers
  • Home
  • Geography Resources for Teachers
    • Global Studies Resources
    • Human Geography Resources
    • World Geography Resources
  • Incorporating GIS into 9-12
    • GIS in a STEM Curriculum >
      • GIS&T Modules
    • Geographic Information Systems Resources
  • Topics in Geography
    • Examining the Arctic: Iceland >
      • Examining the Arctic: Blog
    • Modern Germany
    • Prairie Restoration
    • Teaching Global Competence >
      • TGC Study >
        • TGC Resources
      • TGC Travel >
        • TGC Blog
      • TGC Teach >
        • Geography Resources for Teachers
    • Topics in African Geography
  • Presentations
  • Mission

Examining ARctic Iceland Blog

Walking on Precarious Ice: Using Google Earth to Measure the Effect of Global Warming

3/6/2018

3 Comments

 
In the spring of 2017 I was selected as a National Geographic Grosvenor Teacher Fellow.  As part of the program I was invited to join National Geographic and Lindblad Expeditions aboard the National Geographic Explorer on a circumnavigation around Iceland in July, 2017.  As part of the expedition I was flown out to the National Geographic headquarters in Washington D.C., along with the 34 other fellows, where we were trained in photography, outreaches, what to expect on the expedition, and then Google provided us with tools that might be useful to us on the expedition. I had an idea what to expect out of Iceland, but it ended up being so much more than that! Going in I had some ideas of what I wanted to develop materials on, but it quickly became apparent that there was endless possibilities in Iceland to find materials that I could share with my students about. Back home in the US there was a lot of debate among politicians about the value of combating global warming at home, and maintaining affiliation with the Paris Climate Agreement, in Iceland I came face to face with the effects of global warming and it was pretty easy to see the need to develop a lesson based on that. 
Picture
After touring along the southeastern side of the island we were taken to the glacier aboard super jeeps, and then onto the glacier itself on snowmobiles. (Photo Credit: Mircea Arsenie)
Picture
Our glacier exploring snowmobiles, we had guides to ensure we did not fall into a weak part of the ice (photo credit: Kyle Tredinnick)
Picture
Vatnajokull as seen from the National Geographic Explorer the "night" before. (photo credit: Kyle Tredinnick)
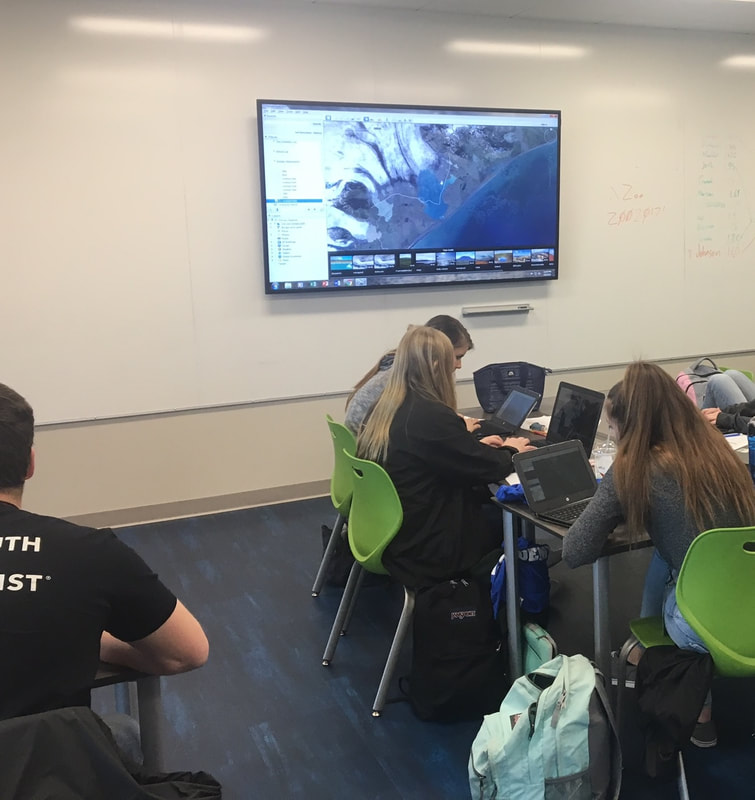
Using the Timelapse program that was developed using the Google Earth Engine it is also possible to watch the changing of the glaciers since 1984. To display this better to my students I put together a gallery of glaciers changing using the Time Machine Program,  which does a great job of showing how to put together your own gallery in the available tutorial. The program I put together highlighting different glaciers  can be accessed HERE.    In the program you can scroll to just about any glacier or ice cap in the Northern Hemisphere you will notice a pretty significant decline. The Columbia Glacier in southern Alaska, or the Helheim Glacier in eastern Greenland also offer some interesting  views of the changes glaciers are undergoing. While viewing the Vatnajokull glacier with this platform  it is visible to see the glacier shrinking on all sides, and significant receding rapidly near the Breiðamerkurjökull arm.  A different trend can be observed in Antarctica with the Timelapse program, where some glaciers are even growing. This article by Inside Climate News explains why the Antarctic is not impacted as much by global warming. The imagery offers a great way to show the students a broad overview, and then in the next part of the activity they can then examine a glacier more closely to find data on just how much the glaciers are retreating. 
One of the tools we worked with in D.C. was the historical imagery offered on Google Earth Pro.  It offered an interactive way of being able to see change over time, and I thought it was a perfect way to show the real effect that climate change is having on the glaciers of Iceland. The activity I decided to put together on the topic looks specifically at imagery of the Breiðamerkurjökull glacier, which is part of the Vatnajökull Ice Cap in southeast Iceland.  To have students investigate just how much glaciers are receding I have them examine Breiðamerkurjökull glacier by viewing the earth imagery from 1984 and marking the face of the glacier by drawing a path along the face of the glacier. They then examine the glacier's most recent position, which is from 2016, again marking the face using the path tool. Using the measure tool of Google Earth they then calculate the mean distance of retreat using 10 different measurements between the 2016 line and the 1984 line. More detailed descriptions of the activity are in the lesson plan and assignment handout located below.
Seeing Climate Change (Lesson Plan)
File Size: 322 kb
File Type: pdf
Download File

Measuring Climate Change (Handout)
File Size: 505 kb
File Type: pdf
Download File

After completing the lesson the most frequent comment received from students was just the shock at how much the glaciers are receding everywhere. The remote sensing is not too hard at all for the students to grasp, and provides an extra tool for the students to really be able to explore the effects of climate change, not just be told about them.  One of the best unintended effects was the ability to perform a bit of statistical analysis that reached across the different classes. Based on each student's mean that they calculated we were able to calculate a class average. From there we were also able to compare to other classes to determine outliers and collect over 200 measurements to give us an even more clear idea of just how much climate change is impacting this one specific glacier. One of the best things that came out of this activity was that at least a couple students recognized the need to act and that led to discussions on what ordinary citizens can do to address global issues like climate change.  
Picture
Students complete the remote sensing portion of the assignment where they use historical imagery from google earth to calculate the subsequent melting of Breiðamerkurjökull glacier (Photo credit: Kyle Tredinnick)
3 Comments
Alabama Ebony link
5/5/2021 03:01:12 pm

Grreat post thankyou

Reply
Ceiling Repair Utah link
11/11/2022 09:42:47 pm

Great post much appreciate the time you took to write this

Reply
Bolton Escort Guide link
3/5/2025 07:42:17 am

I think it's fascinating how technology like Google Earth Engine allows us to visualize these changes over time.

Reply


Leave a Reply.

    Kyle Tredinnick

    2017 - Grosvenor Teacher Fellow (Iceland Expedition)
    ​
    Omaha Public Schools – Social Studies Teacher

    Archives

    March 2018
    January 2018

    Categories

    All

    RSS Feed

Picture
Sites published and maintained by Kyle Tredinnick | 2016-2021
  • Home
  • Geography Resources for Teachers
    • Global Studies Resources
    • Human Geography Resources
    • World Geography Resources
  • Incorporating GIS into 9-12
    • GIS in a STEM Curriculum >
      • GIS&T Modules
    • Geographic Information Systems Resources
  • Topics in Geography
    • Examining the Arctic: Iceland >
      • Examining the Arctic: Blog
    • Modern Germany
    • Prairie Restoration
    • Teaching Global Competence >
      • TGC Study >
        • TGC Resources
      • TGC Travel >
        • TGC Blog
      • TGC Teach >
        • Geography Resources for Teachers
    • Topics in African Geography
  • Presentations
  • Mission